《C++程序设计原理与实践》笔记 第15章 绘制函数图和数据图
本章讨论绘制函数图和数据图的基本机制。关键例子是绘制一元函数图像,以及展示从文件中读取的值。
15.1 引言
我们的主要目标不是输出的美观性,而是理解如何生成这样的图形输出以及所使用的编程技术。你会发现,本章使用的设计技术、编程技术和基本数学工具比展示的图形功能有更长久的价值。
15.2 绘制简单函数图
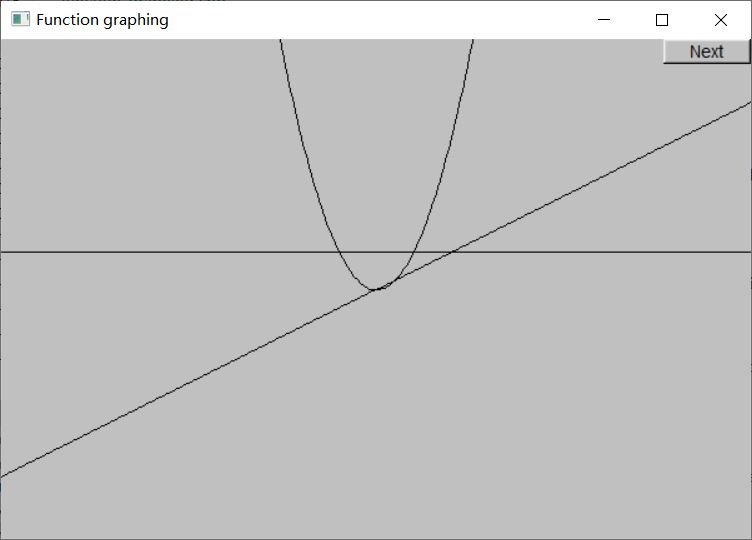
下面的代码绘制了 $y = 1$、$y = \frac{x}{2}$ 和 $y = x^2$ 三个函数:
首先定义了一组常量来避免“魔数”,之后定义了三个Function。Function在窗口中绘制其第一个参数(具有一个double参数、返回double的函数),第二个和第三个参数指定了自变量的范围(定义域),第四个参数指定原点在窗口中的位置,后三个参数将在下一节中解释。
注:Function自动对y轴做了上下翻转。
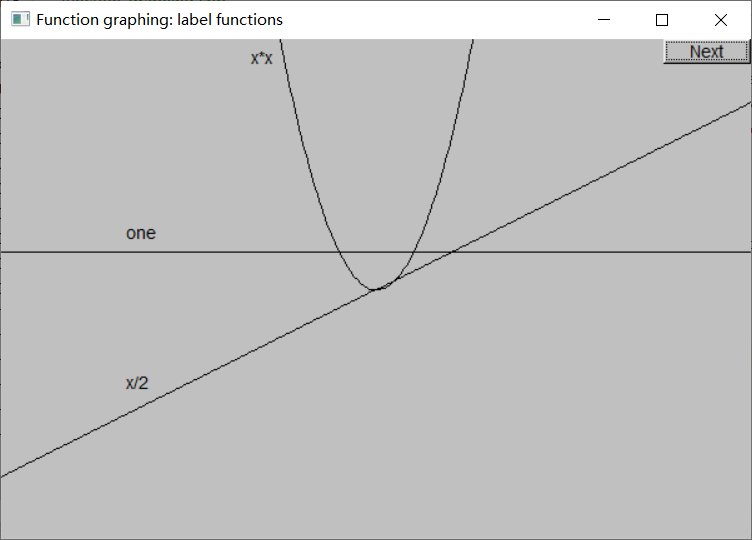
下面使用Text对象为函数图像添加标签:
1
2
3
Text ts(Point(100, y_orig - 40), "one");
Text ts2(Point(100, y_orig + y_orig / 2 - 20), "x/2");
Text ts3(Point(x_orig - 100, 20), "x*x");
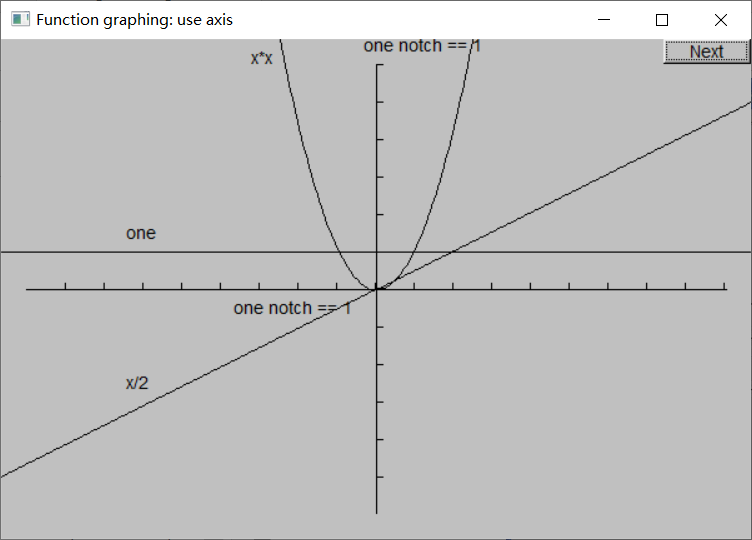
为了更清楚地展示,使用Axis对象添加坐标轴:
1
2
3
4
5
const int xlength = xmax - 40;  // make the axis a bit smaller than the window
const int ylength = ymax - 40;

Axis x(Axis::x, Point(20, y_orig), xlength, xlength / x_scale, "one notch == 1");
Axis y(Axis::y, Point(x_orig, ylength + 20), ylength, ylength / y_scale, "one notch == 1");
这已经可接受了,虽然处于美观的原因,我们可能想要在顶端留出一些空白以便和底部以及两边一致,将x轴的标签放到更左边可能是一个更好的想法——总是会有很多美观细节需要继续完善。程序员的艺术的一部分是知道什么时候停止,将节省出的时间用于更有意义的事情上(比如学习新的技术或者睡觉)。记住:“至善者善之敌”(The best is the enemy of the good)。
15.3 Function
Function类的定义如下:
1
2
3
4
5
6
7
8
9
10
11
12
13
14
15
16
17
18
19
20
21
22
typedef double Fct(double);

struct Function : Shape {
    // the function parameters are not stored
    Function(Fct f, double r1, double r2, Point orig,
        int count = 100, double xscale = 25, double yscale = 25);
};

Function::Function(Fct f, double r1, double r2, Point xy,
                   int count, double xscale, double yscale)
// graph f(x) for x in [r1:r2) using count line segments with (0,0) displayed at xy
// x coordinates are scaled by xscale and y coordinates scaled by yscale
{
    if (r2-r1<=0) error("bad graphing range");
    if (count <=0) error("non-positive graphing count");
    double dist = (r2-r1)/count;
    double r = r1;
    for (int i = 0; i<count; ++i) {
        add(Point(xy.x+int(r*xscale),xy.y-int(f(r)*yscale)));
        r += dist;
    }
}
Function是一种Shape,其构造函数在区间[r1, r2)内等间隔地计算了count次函数f的值,并将这些点存储在Shape部分。(从Shape继承的)draw_lines()函数依次连接这些点,从而近似地绘制了函数f的图像。xscale和yscale分别用于缩放x坐标和y坐标。
注:这里使用typedef为“具有一个double参数、返回double的函数”定义了一个别名Fct,作为构造函数第一个参数的类型,因此上面的例子中可以直接将函数one、slope和square作为参数传递。
15.3.1 默认参数
注意Function构造函数参数xscale和yscale在声明中给定了初始值,这种初始值叫做默认参数(default argument)。如果调用者没有提供参数值,将使用此默认值。例如:
1
2
3
4
Function s(one, r_min, r_max,orig, n_points, x_scale, y_scale);
Function s2(slope, r_min, r_max, orig, n_points, x_scale);  // no yscale
Function s3(square, r_min, r_max, orig, n_points);  // no xscale, no yscale
Function s4(sqrt, r_min, r_max, orig);  // no count, no xscale, no yscale
等价于
1
2
3
4
Function s(one, r_min, r_max, orig, n_points, x_scale, y_scale);
Function s2(slope, r_min, r_max,orig, n_points, x_scale, 25);
Function s3(square, r_min, r_max, orig, n_points, 25, 25);
Function s4(sqrt, r_min, r_max, orig, 100, 25, 25);
另一种替代方法是提供几个重载函数:
1
2
3
4
5
6
7
8
9
10
11
12
struct Function : Shape {  // alternative, not using default arguments
    Function(Fct f, double r1, double r2, Point orig, int count, double xscale, double yscale);
    // default scale of y:
    Function(Fct f, double r1, double r2, Point orig, int count, double xscale)
            :Function(f, r1, r2, orig, count, xscale, 25) {}
    // default scale of x and y:
    Function(Fct f, double r1, double r2, Point orig, int count)
            :Function(f, r1, r2, orig, count, 25) {}
    // default count and default scale of x or y:
    Function(Fct f, double r1, double r2, Point orig)
            :Function(f, r1, r2, orig, 100) {}
};
默认参数经常用于构造函数,但是对所有类型的函数都适用。
注意,只能为末尾的参数定义默认参数。如果一个参数有默认值,那么其后的所有参数都必须有默认值。
记住,你不是必须提供默认参数。如果你发现难以给出默认值,将它留给用户来指定即可。
15.3.2 更多例子
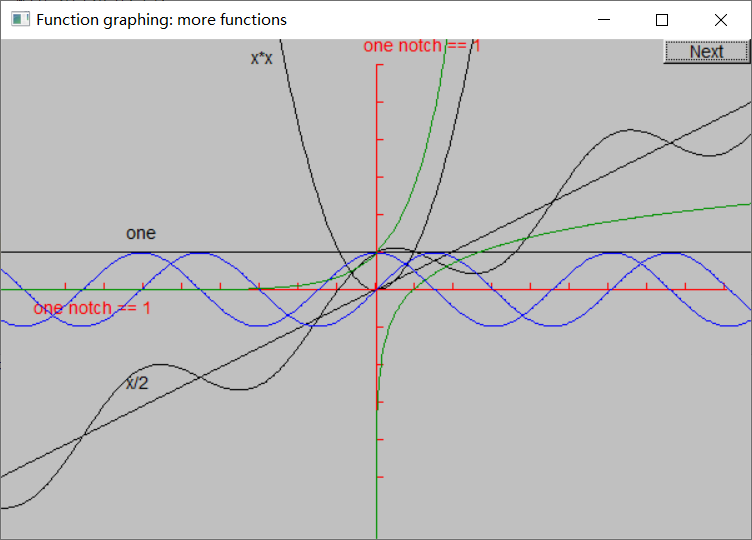
下面的代码增加了 $y = \sin x$、$y = \cos x$、$y = \ln x$、$y = e^x$ 和 $y = \cos x + \frac{x}{2}$ 几个函数的图像:
sin()、cos()、sqrt()等标准数学函数声明在头文件<cmath>中。
15.3.3 Lambda表达式
定义一个仅作为参数传递的函数是冗余的。因此,C++11引入了Lambda表达式,用于在需要的参数位置充当一个函数。例如,可以像这样定义sloping_cos:
1
Function s5([](double x) { return cos(x) + slope(x); }, r_min, r_max, orig, n_points, x_scale, y_scale);
其中,[](double x) { return cos(x) + slope(x); }是一个Lambda表达式,即未命名的函数。Lambda表达式由三部分组成:[]是捕获列表(用于引用当前作用域中的变量),()是参数表,{}是函数体。返回类型可以从函数体中推导出来,也可以显式指定:[](double x) -> double { return cos(x) + slope(x); }。
如果函数体无法放在一两行内,我们建议使用命名函数。
关于捕获列表详见21.4.3节。
注:无捕获的Lambda表达式可以被转换为函数指针,但有捕获的Lambda表达式不可以。 因此上面的Lambda表达式可以被传递给double(double)(即Fct)或double (*)(double)类型的参数,但[n](double x) { return x + n; }不可以。
15.4 Axis
当我们展示数据时,就需要使用坐标轴。一个Axis由一条线、这条线上的一系列刻度和一个文本标签组成。
1
2
3
4
5
6
7
8
9
10
11
12
struct Axis : Shape {
    enum Orientation { x, y, z };
    Axis(Orientation d, Point xy, int length,
        int number_of_notches=0, string label = "");

    void draw_lines() const override;
    void move(int dx, int dy) override;
    void set_color(Color c);

    Text label;
    Lines notches;
};
其中label和notches对象是公有的,从而用户可以直接操纵,例如为刻度设置和线不同的颜色或者移动标签。Axis是一个由若干半独立对象组成的对象的例子。
Axis的构造函数负责放置一条线并添加刻度:
1
2
3
4
5
6
7
8
9
10
11
12
13
14
15
16
17
18
19
20
21
22
23
24
25
26
27
28
29
30
31
32
33
34
35
36
37
38
39
40
41
42
43
Axis::Axis(Orientation d, Point xy, int length, int n, string lab) :
    label(Point(0,0),lab)
{
    if (length<0) error("bad axis length");
    switch (d){
    case Axis::x:
    {
        Shape::add(xy); // axis line
        Shape::add(Point(xy.x+length,xy.y));

        if (0<n) {      // add notches
            int dist = length/n;
            int x = xy.x+dist;
            for (int i = 0; i<n; ++i) {
                notches.add(Point(x,xy.y),Point(x,xy.y-5));
                x += dist;
            }
        }
        // label under the line
        label.move(length/3,xy.y+20);
        break;
    }
    case Axis::y:
    {
        Shape::add(xy); // a y-axis goes up
        Shape::add(Point(xy.x,xy.y-length));

        if (0<n) {      // add notches
            int dist = length/n;
            int y = xy.y-dist;
            for (int i = 0; i<n; ++i) {
                notches.add(Point(xy.x,y),Point(xy.x+5,y));
                y -= dist;
            }
        }
        // label at top
        label.move(xy.x-10,xy.y-length-10);
        break;
    }
    case Axis::z:
        error("z axis not implemented");
    }
}
注意,我们(使用Shape::add())将线的两个端点存储在Axis的Shape部分,而将刻度存储在一个独立的Lines对象(notches)中。通过这种方式,我们可以独立地操纵这条线和刻度,例如设置不同的颜色。
由于Axis有三个部分,因此当我们希望将其作为一个整体来操纵时,必须提供相应的函数。
1
2
3
4
5
6
7
8
9
10
11
12
13
14
15
16
17
18
19
20
void Axis::draw_lines() const
{
    Shape::draw_lines();
    notches.draw();  // the notches may have a different color from the line
    label.draw();    // the label may have a different color from the line
}

void Axis::set_color(Color c)
{
    Shape::set_color(c);
    notches.set_color(c);
    label.set_color(c);
}

void Axis::move(int dx, int dy)
{
    Shape::move(dx,dy);
    notches.move(dx,dy);
    label.move(dx,dy);
}
我们使用draw()而不是draw_lines()来绘制notches和label,从而能够使用它们各自的颜色。而线的颜色存储在Shape中,被Shape::draw()使用。
注:由于Shape::set_color()不是虚函数,因此Axis::set_color()隐藏(而不是覆盖)了基类的函数,无法通过Shape指针或引用来调用Axis::set_color()。
15.5 近似
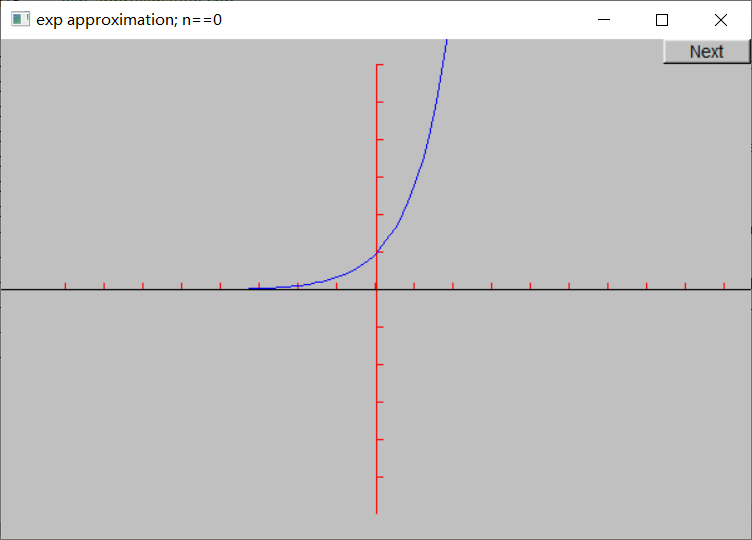
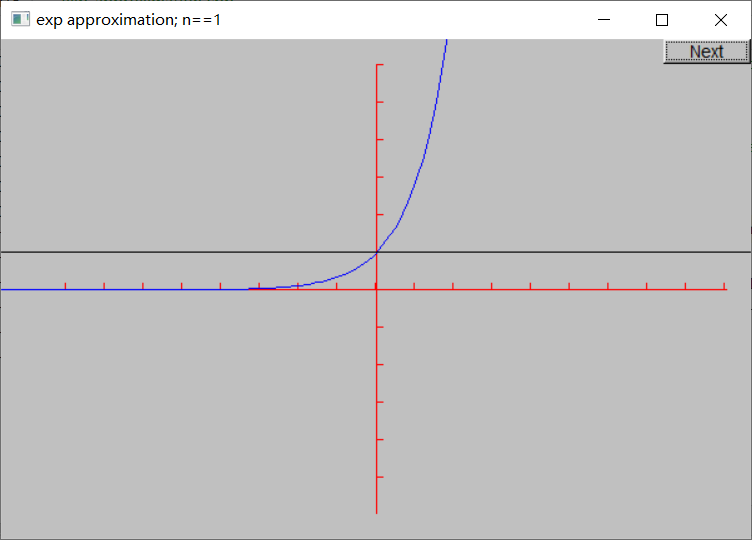
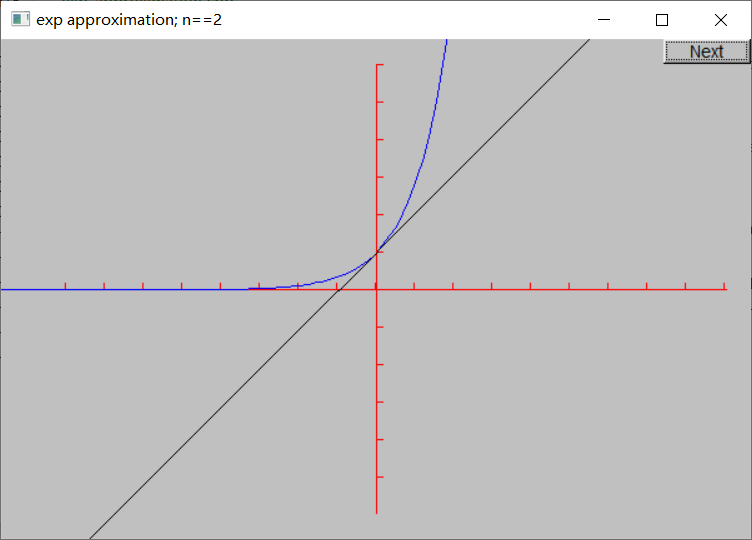
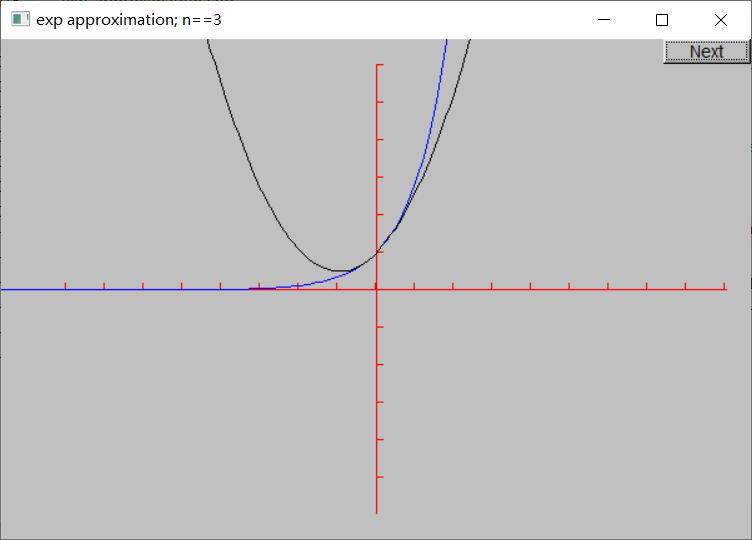
本节给出了绘制函数的另一个例子:“动态化”指数函数的计算。
计算指数函数的一种方式是计算泰勒级数:
\[e^x = \sum_{n=0}^{\infty} \frac{x^n}{n!} = 1 + x + \frac{x^2}{2!} + \frac{x^3}{3!} + ...\]我们计算的项越多,得到的ex的值就越精确。我们要做的是计算这个序列,并在计算每一项之后图形化显示其结果。也就是说,我们要按顺序绘制以下函数:
1
2
3
4
5
6
7
exp0(x) = 0      // no terms
exp1(x) = 1      // one term
exp2(x) = 1 + x  // two terms
exp3(x) = 1 + x + x^2/2!
exp4(x) = 1 + x + x^2/2! + x^3/3!
exp5(x) = 1 + x + x^2/2! + x^3/3! + x^4/4!
...
每个函数都是比前一个更好的ex的近似(approximation)。
标准库中没有阶乘函数,因此我们必须自己定义。有了fac(),就可以使用term()计算级数的第n项。有了term(),就可以使用expe()计算前n项的和,即上面的第n个近似函数。
从编程的角度,使用expe()的困难在于Function只接受具有一个参数的函数,而expe()有两个参数。在C++中,目前还没有此问题的完美解决方法。这里使用了一个简单的、并不完美的解决方法:使用一个全局变量expN_number_of_terms表示精度n,并定义另一个函数expN()作为Function的参数:
1
2
3
4
5
int expN_number_of_terms = 10;

double expN(double x) {
    return expe(x, expN_number_of_terms);
}
注:
- C++11中可以使用
std::function和std::bind固定函数的部分参数,但这样无法转换为Function所需的函数指针类型。 - 第二版书中的代码使用了Lambda表达式
[n](double x) { return expe(x, n); }。但这是错误的,因为有捕获的Lambda表达式不能被转换为函数指针: “no known conversion for argument 1 from ‘main()::<lambda(double)>’ to ‘double (*)(double)’” 。除非将类型Fct改为using Fct = std::function<double(double)>;,但这样又无法直接使用exp()等标准库函数作为参数,因为这些函数有float和double两个重载版本: “no known conversion for argument 1 from ‘<unresolved overloaded function type>’ to ‘Graph_lib::Fct’ {aka ‘std::function<double(double)>’}” 。
现在可以生成图形了。首先提供了坐标轴和真实的指数函数,之后通过循环来绘制一系列近似函数。注意循环最后的detach(e)。Function对象e的作用域是for循环体内,每次循环结束后就会被销毁,因此detach(e)保证窗口不会绘制一个已经被销毁的对象。
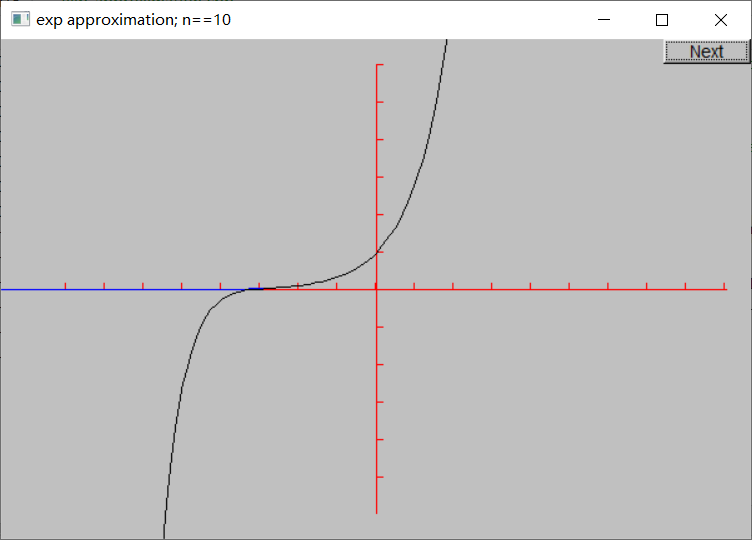
下面是n = 0, 1, …, 10的近似结果:
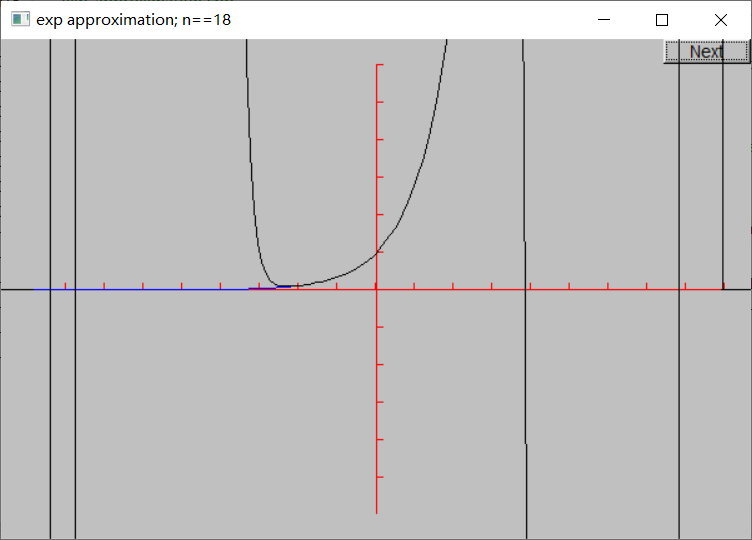
看起来计算的项数越多就会得到越好的近似。然而,这是有极限的,当超过13项之后会开始发生一些奇怪的事情。首先,近似值开始变差,而在第18项会出现一些竖直线:
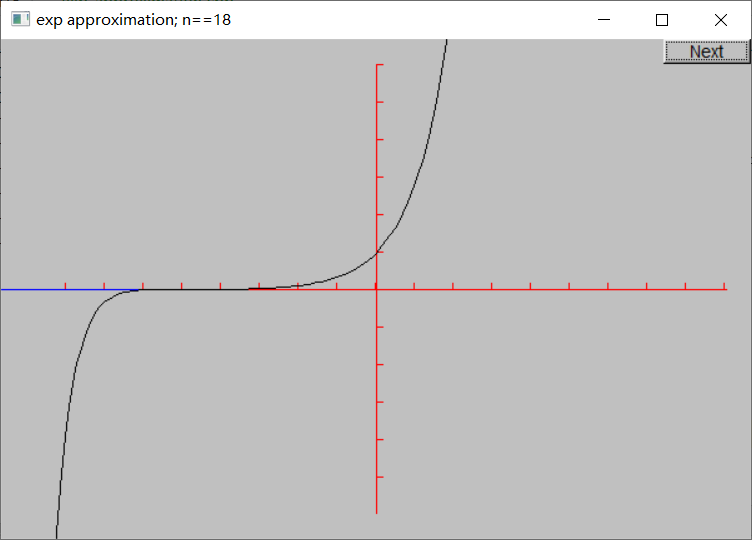
记住,计算机的算术不是纯粹的数学 ——double只是实数的近似,而在int中放入过大的整数会溢出。产生这一现象的原因是fac()的结果超过了int的最大范围(12! < 231-1 < 13!)。将fac()的返回值类型改为double即可解决这一问题:
(修正前的)最后一张图片很好地阐述了 “看起来正确”不等同于“通过测试” 这一原则。在把程序交给其他人使用之前,首先要在超过最初看起来合理的范围内对其进行测试。除非你对程序有更深的理解,否则稍微延长运行时间或者使用稍微不同的数据就可能导致程序陷入混乱——就像本例一样。
15.6 绘制数据图
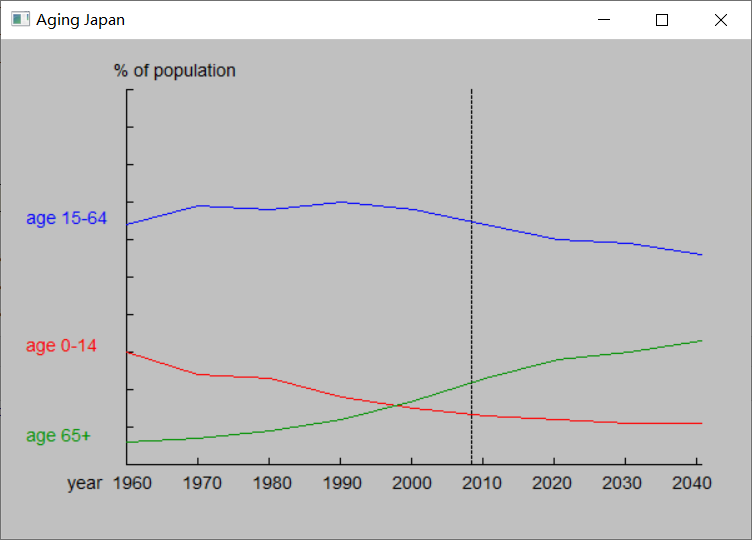
本节的例子展示从文件中读取的数据,如下图所示。这些数据表示近一个世纪以来日本人的年龄构成,虚线(2008年)右侧的数据是预测的。
我们将使用这个例子来讨论显示这种数据涉及的程序设计问题:
- 读取文件
- 缩放数据以适合窗口大小
- 显示数据
- 给图形加上标签
15.6.1 读取文件
年龄分布的文件由像这样的行组成:
1
2
3
( 1960 : 30 64 6 )
(1970 : 24 69 7 )
(1980 : 23 68 9 )
冒号后面的第一个数字是儿童(0~14岁)在总人口中的百分比,第二个是成年人(15~64岁)的百分比,第三个是老年人(65岁以上)的百分比。
为了简化读取数据的任务,我们定义一个保存数据项的类型Distribution和一个读取这些数据项的输入运算符。
1
2
3
4
5
6
7
8
9
10
11
12
13
14
15
16
17
18
19
struct Distribution {
    int year, young, middle, old;
};

// assume format: ( year : young middle old )
istream& operator>>(istream& is, Distribution& d) {
    char ch1 = 0, ch2 = 0, ch3 = 0;
    Distribution dd;

    if (!(is >> ch1 >> dd.year >> ch2 >> dd.young >> dd.middle >> dd.old >> ch3))
        return is;
    else if (ch1 != '(' || ch2 != ':' || ch3 != ')') {
        is.clear(ios_base::failbit);
        return is;
    }

    d = dd;
    return is;
}
这是10.9节中的思想的直接应用。我们使用Distribution类型和>>运算符将代码划分为几个逻辑部分,有助于理解和调试。我们通过定义类型使得代码更加直接地对应我们思考概念的方式。
15.6.2 一般布局
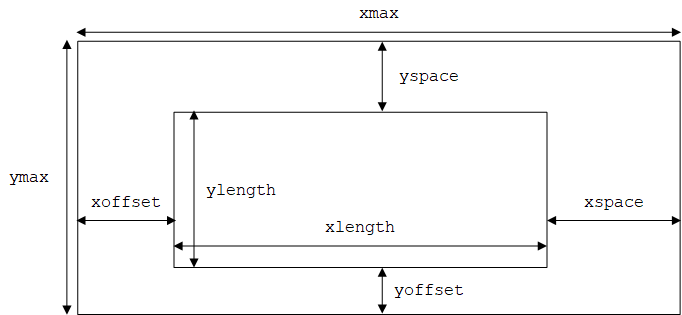
让绘图代码既正确又美观是非常棘手的。主要原因是我们必须要做很多有关尺寸和偏移量的高精度计算。为了简化,我们首先定义一组符号常量来表示我们使用屏幕空间的方式:
1
2
3
4
5
6
7
8
9
10
11
constexpr int xmax = 600;       // window size
constexpr int ymax = 400;

constexpr int xoffset = 100;    // distance from left-hand side of window to y axis
constexpr int yoffset = 60;     // distance from bottom of window to x axis

constexpr int xspace = 40;      // space beyond axis
constexpr int yspace = 40;

constexpr int xlength = xmax - xoffset - xspace;    // length of axes
constexpr int ylength = ymax - yoffset - yspace;
这里定义了一个矩形空间(窗口)以及内部的另一个矩形(由坐标轴定义),如下图所示。
15.6.3 缩放数据
接下来需要定义如何让数据适合这个空间。我们通过缩放数据使其适应坐标轴定义的空间,为此需要缩放因子,即数据范围和坐标轴范围之间的比值:
1
2
constexpr double xscale = double(xlength) / (end_year - base_year);
constexpr double yscale = double(ylength) / 100;
注意缩放因子(xscale和yscale)必须是浮点数,否则计算会产生严重的舍入误差。
年份和年龄比例可以按相同的方式分别转换为x坐标和y坐标:
1
2
x = xoffset + (year - base_year) * xscale
y = yoffset + (percent - 0) * yscale
为了简化代码并最小化出错的机会,我们定义一个很小的类来完成这个计算:
1
2
3
4
5
6
7
8
9
10
// data value to coordinate conversion
class Scale {
    int cbase;  // coordinate base
    int vbase;  // base of values
    double scale;

public:
    Scale(int b, int vb, double s) :cbase(b), vbase(vb), scale(s) {}
    int operator()(int v) const { return cbase + (v - vbase) * scale; }
};
Scale类负责将区间[vbase, +∞)映射到[cbase, +∞),并放缩scale倍。即给定v,求c,使得c - cbase = (v - vbase) * scale。
于是可以定义:
1
2
Scale xs(xoffset, base_year, xscale);
Scale ys(ymax - yoffset, 0, -yscale);
注意,我们使ys的缩放因子为负以反映窗口的y坐标是向下增长的。
现在可以使用xs将年份转换为x坐标,使用ys将百分比转换为y坐标:
1
2
int x = xs(d.year);
int y = ys(d.young);
由于Scale类重载了()运算符,因此xs和ys可以像函数一样被调用。
15.6.4 构造图像
最后,我们可以编写绘图代码。首先创建窗口并放置坐标轴:
1
2
3
4
5
6
7
8
9
10
11
12
Graph_lib::Window win(Point(100, 100), xmax, ymax, "Aging Japan");

Axis x_axis(
        Axis::x, Point(xoffset, ymax - yoffset), xlength, (end_year - base_year) / 10,
        "year  1960      1970      1980      1990      "
        "2000      2010      2020      2030      2040");
x_axis.label.move(-100, 0);

Axis y_axis(Axis::y, Point(xoffset, ymax - yoffset), ylength, 10, "% of population");

Line current_year(Point(xs(2008), ys(0)), Point(xs(2008), ys(100)));
current_year.set_style(Line_style::dash);
坐标轴的交点Point(xoffset, ymax - yoffset)表示(1960, 0)。y轴的每个刻度表示10%的人口,x轴的每个刻度表示10年。
注意x轴标签的字符串格式:相邻的两个字符串常量会被编译器拼接起来,这是一个用来布局长字符串常量从而使代码可读性更强的有用技巧。
current_year是一条分隔已知数据和预测数据的垂直线。
有了坐标轴,我们就可以处理数据了。可以使用Open_polyline来绘制折线图。定义三个Open_polyline,并在读取循环中填充数据:
1
2
3
4
5
6
7
8
9
10
11
12
13
14
Open_polyline children;
Open_polyline adults;
Open_polyline aged;

for (Distribution d; ifs >> d;) {
    if (d.year < base_year || d.year > end_year)
        error("year out of range");
    if (d.young + d.middle + d.old != 100)
        error("percentages don't add up");
    const int x = xs(d.year);
    children.add(Point(x, ys(d.young)));
    adults.add(Point(x, ys(d.middle)));
    aged.add(Point(x, ys(d.old)));
}
为了使图形更具有可读性,我们为每个图形添加标签并设置颜色:
1
2
3
4
5
6
7
8
9
10
11
Text children_label(Point(20, children.point(0).y), "age 0-14");
children.set_color(Color::red);
children_label.set_color(Color::red);

Text adults_label(Point(20, adults.point(0).y), "age 15-64");
adults.set_color(Color::blue);
adults_label.set_color(Color::blue);

Text aged_label(Point(20, aged.point(0).y), "age 65+");
aged.set_color(Color::dark_green);
aged_label.set_color(Color::dark_green);
最后将所有的Shape对象附加到Window,并启动GUI系统:
1
2
3
4
5
6
7
8
9
10
11
12
13
win.attach(x_axis);
win.attach(y_axis);
win.attach(current_year);

win.attach(children);
win.attach(adults);
win.attach(aged);

win.attach(children_label);
win.attach(adults_label);
win.attach(aged_label);

gui_main();
其中gui_main()函数声明在Window.h中,作用是进入FLTK主循环,类似于Simple_window::wait_for_button()。
完整代码:绘制日本人年龄构成
最终效果如下图所示:
